Daily News 22 11 2024

Important News of the Day

Zaman Önem Ülke Olay Beklenen Önceki Açıklanan
00:30 United States (USD) Fed's Balance Sheet 6,967B 6,924B
00:40 United States (USD) Fed Vice Chair for Supervision Barr Speaks
02:30 Japan (JPY) National Core CPI (YoY) (Oct) 2.2% 2.4% 2.3%
03:30 Japan (JPY) au Jibun Bank Japan Services PMI (Nov) 49.7 50.2
10:00 United Kingdom (GBP) Core Retail Sales (MoM) (Oct) -0.3% 0.1% -0.9%
10:00 United Kingdom (GBP) Core Retail Sales (YoY) (Oct) 3.3% 3.2% 2.0%
10:00 United Kingdom (GBP) Retail Sales (MoM) (Oct) -0.3% 0.1% -0.7%
10:00 United Kingdom (GBP) Retail Sales (YoY) (Oct) 3.4% 3.2% 2.4%
10:00 Germany (EUR) German GDP (YoY) (Q3) -0.2% -0.2% -0.3%
10:00 Germany (EUR) German GDP (QoQ) (Q3) 0.2% 0.2% 0.1%
11:30 Germany (EUR) HCOB Germany Manufacturing PMI (Nov) 43.1 43.0 43.2
11:30 Germany (EUR) HCOB Germany Services PMI (Nov) 51.8 51.6 49.4
11:30 Euro Zone (EUR) ECB President Lagarde Speaks
11:40 Euro Zone (EUR) ECB's De Guindos Speaks
12:00 Euro Zone (EUR) HCOB Eurozone Manufacturing PMI (Nov) 46.0 46.0 45.2
12:00 Euro Zone (EUR) HCOB Eurozone Composite PMI (Nov) 50.0 48.1
12:00 Euro Zone (EUR) HCOB Eurozone Services PMI (Nov) 51.6 51.6 49.2
12:30 United Kingdom (GBP) S&P Global/CIPS UK Composite PMI (Nov) 51.8 49.9
12:30 United Kingdom (GBP) S&P Global/CIPS UK Manufacturing PMI (Nov) 50.1 49.9 48.6
12:30 United Kingdom (GBP) S&P Global/CIPS UK Services PMI (Nov) 52.3 52.0 50.0
14:15 Euro Zone (EUR) ECB Supervisory Board Member Tuominen Speaks
16:00 Germany (EUR) German Buba President Nagel Speaks
16:30 Canada (CAD) Core Retail Sales (MoM) (Sep) 0.5% -0.8% 0.9%
16:30 Canada (CAD) New Housing Price Index (MoM) (Oct) 0.1% 0.0% -0.4%
16:30 Canada (CAD) Retail Sales (MoM) (Sep) 0.4% 0.4% 0.4%
16:30 Canada (CAD) Wholesale Sales (MoM) (Oct) 0.9% -0.6%
17:45 United States (USD) S&P Global US Manufacturing PMI (Nov) 48.8 48.5 48.8
17:45 United States (USD) S&P Global Composite PMI (Nov) 54.1 55.3
17:45 United States (USD) S&P Global Services PMI (Nov) 55.2 55.0 57.0
18:00 United States (USD) Michigan 1-Year Inflation Expectations (Nov) 2.6% 2.6% 2.6%
18:00 United States (USD) Michigan 1-Year Inflation Expectations (Nov) 2.6% 2.7% 1
18:00 United States (USD) Michigan 5-Year Inflation Expectations (Nov) 3.1% 3.1% 3.2%
18:00 United States (USD) Michigan Consumer Expectations (Nov) 78.5 78.5 76.9
18:00 United States (USD) Michigan 5-Year Inflation Expectations (Nov) 3.1% 3.0% 1
18:00 United States (USD) Michigan Consumer Sentiment (Nov) 73.0 73.0 71.8
18:45 Euro Zone (EUR) ECB's Schnabel Speaks
21:00 United States (USD) U.S. Baker Hughes Oil Rig Count 478 479
21:00 United States (USD) U.S. Baker Hughes Total Rig Count 584 583
23:30 United Kingdom (GBP) CFTC GBP speculative net positions 56.0K
23:30 United States (USD) CFTC Crude Oil speculative net positions 186.9K
23:30 United States (USD) CFTC Gold speculative net positions 236.5K
23:30 United States (USD) CFTC Nasdaq 100 speculative net positions 16.4K
23:30 United States (USD) CFTC S&P 500 speculative net positions 25.0K
23:30 Australia (AUD) CFTC AUD speculative net positions 29.8K
23:30 Japan (JPY) CFTC JPY speculative net positions -64.9K
23:30 Euro Zone (EUR) CFTC EUR speculative net positions -7.4K

Unilever Unveils Strategic Growth Plan, Aiming for Maximum Returns

image

Global consumer goods company Unilever is today outlining its progress under the "Growth Action Plan 2030" and future strategies at its Investor Event. The plan aims to deliver consistent and superior performance through market-leading brands.

The company confirmed that it is on track to complete its comprehensive €800 million efficiency program and finalize the separation of its Ice Cream division by the end of 2025. Following the separation, Unilever will focus on four core Business Groups previously known as Nutrition: Beauty & Wellbeing, Personal Care, Home Care, and Foods.

These groups will be driven by 30 Power Brands in 24 key markets, which account for approximately 85% of Unilever’s turnover. Other markets will operate under a unified Unilever strategy to benefit from scale and simplicity.

The Growth Action Plan 2030 aims to enhance existing strategies and improve performance through three strategic pillars: Focus, Excellence, and Acceleration. The Focus pillar will concentrate on Power Brands and key markets with the highest return potential. This includes strategies to double investments in India, accelerate growth in the U.S., and selectively expand in emerging markets.

Under the Excellence pillar, Unilever will focus on five opportunities to drive brand growth: superior brand quality, social media-driven demand creation, scalable innovations, a shift to premium offerings, and growth channels.

The Acceleration pillar will prioritize capabilities such as science and technology, lean and agile supply chain, net efficiency, and scaled artificial intelligence to enhance performance.

Unilever's medium-term targets remain consistent. The company aims for mid-single-digit underlying sales growth supported by at least 2% underlying volume growth. Moreover, it expects moderate improvements in underlying operating profit margin, driven by gross margin expansion and efficiency gains.

With ambitions to deliver total shareholder returns in the top third among competitors and achieve high teens underlying returns on invested capital, Unilever's CEO Hein Schumacher expressed confidence in the Growth Action Plan 2030. Schumacher emphasized the company's commitment to delighting consumers and driving growth as Unilever continues its transformation.

The company's new purpose, "To make daily life more enjoyable for everyone," reflects its focus on enhancing global consumer experiences. Schumacher shared his excitement about the opportunities ahead and the company’s potential, indicating that detailed plans will be shared with investors throughout the day.

Market Overview Insights

image

Forex -

The Stigma of the Fed’s Discount Window Persists in the Post-Crisis Era

image

The New York Federal Reserve Bank published a comprehensive analysis regarding the stigma associated with the Federal Reserve's Discount Window (DW) from 2014 to 2024. The report shows that stigma persists, particularly among small banks and during periods of financial distress, despite policy changes aimed at encouraging its use. The study highlights that the reluctance to utilize the DW, seen as a lender of last resort, was notable even months before the banking turmoil in 2023 and continued a year later.

The DW provides backup financing to sound depository institutions against various types of collateral. Over the years, the Fed has modified DW policies to promote borrowing and reduce stigma. Notably, at the onset of the COVID-19 pandemic in 2020, the Fed lowered the primary credit rate to 0.25% and extended loan maturities to 90 days, among other changes. Nevertheless, stigma has not been entirely eliminated.

The report details that small domestic banks with less than $50 billion in assets paid an additional $0.5 billion in interest by borrowing federal funds at rates above the DW rate during the year following the failure of First Republic Bank on May 31, 2023. This occurred even as liquidity markets appeared to normalize, indicating that stigma remains a more costly and persistent issue for smaller institutions.

Analysis reveals that a bank experiencing stigma has approximately a 40% higher likelihood of facing stigma again the following month. Additionally, banks that visit the DW are less affected by subsequent stigma. Financial weakness also increases a bank's sensitivity to stigma, which tends to be a stronger indicator of a bank's risk of failure than DW borrowing.

The study also examined DW borrowing patterns post-2014, noting that pre-COVID-19, DW activity was minimal but reached a record level of $49.8 billion during the pandemic. The March 2023 banking turmoil saw a further substantial increase in DW borrowing, with outstanding amounts reaching $155 billion, significantly higher than at the onset of the global financial crisis or the pandemic.

Evidence of DW stigma was not limited to the federal funds market; it was also present in other funding markets. The report suggests that stigma was visible around the last three major financial disruptions: the September 2019 repo market disruption, the onset of the COVID-19 pandemic, and the March 2023 banking turmoil.

The New York Fed's findings indicate the complexity of addressing DW stigma and raise questions about the effectiveness of current policies. The continued stigma, especially among small banks, suggests significant challenges to the Fed's goal of promoting regular DW access "in good times and bad." The report concludes that further research is needed to understand why stigma persists and how reforms can be effectively implemented to encourage the use of the DW without associated stigma.

Texas Pacific Land Shares Surge with Plan to Join S&P 500, Set to Replace Marathon Oil

image

Texas Pacific Land Corp. (NYSE: TPL) shares rose by over 6% on Friday in anticipation of being added to the S&P 500, replacing Marathon Oil Corp. (NYSE: MRO). This change is set to take place before markets open on Tuesday, November 26. The move is occurring due to the acquisition of Marathon Oil by S&P 500 and 100 component ConocoPhillips (NYSE: COP). The acquisition is expected to be completed on Monday, November 22, subject to the fulfillment of remaining closing conditions.

At the same time, S&P SmallCap 600 member Mueller Industries Inc. (NYSE: MLI) will elevate to the S&P MidCap 400, filling the gap left by Texas Pacific Land. Additionally, Atlas Energy Solutions Inc. (NYSE: AESI) will replace Mueller Industries in the S&P SmallCap 600.

These adjustments in the indices reflect the changing market values of the respective companies. Texas Pacific Land and Mueller Industries now more accurately represent the large-cap and mid-cap market segments, respectively. These changes in index composition are part of a regular process to ensure that the indices accurately reflect the market segments they aim to measure.

MARKET OVERVIEW - Stock Market Ends the Day with a Nearly 2% Increase

image

The BIST 100 index closed the day at 9,549.89 points, up 182.12 points. According to the Foreks News survey, it was expected that the BIST 100 index would close with an increase of 95.88 points. The closest prediction in the BIST 100 index closing survey was made by A1 Capital/Elvan Moğulkoç with an estimate of 172.55 points. The second closest prediction was made by İş Yatırım/Zehra Taş at 195.73 points. The third closest estimate was provided by InvestAZ Yatırım/Enes Ciğerci at 157.5 points. A total of 34 analysts from brokerage firms participated in today’s Foreks News BIST 100 index closing survey; 29 analysts predicted a positive closing, while 5 analysts anticipated a negative closing. NOTE: Investment professionals who wish to participate in the daily BIST 100 surveys organized by Foreks News can send an application email to neslihan.koroglu@forinvest.com.

NGCUSD

Daily Newsletter
22 Nov 2024 10:30

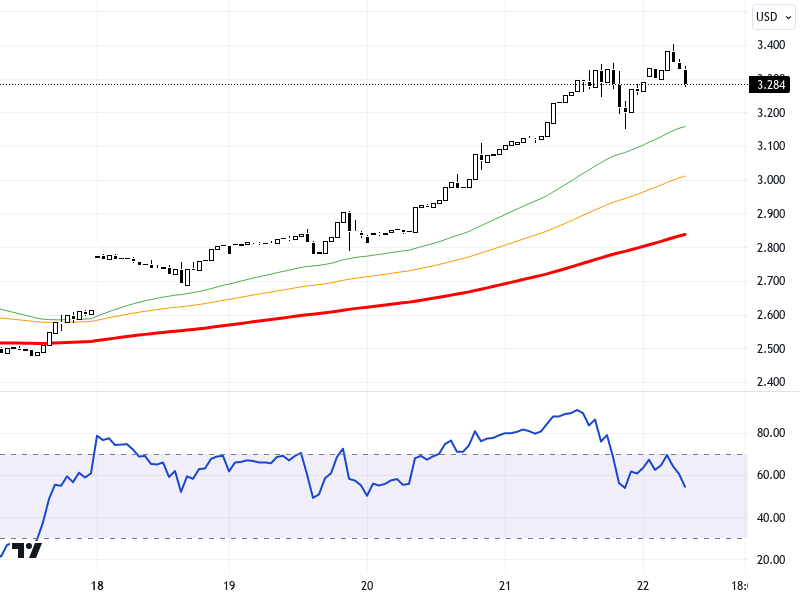
U.S. natural gas futures showed limited correction movements as they attempted to sustain their gains amid cold weather forecasts and an unexpected drop in inventories. It is noted that the performance of European and U.S. stock markets could impact natural gas pricing. Increasing geopolitical risks in the U.S. and statements by Fed Chair Powell regarding interest rate policy are causing uncertainty in the markets. Particularly, the PMI data to be released in the U.S. and the UK could provide insights into the future of economic activity.

When examining the NGCUSD pair on the daily chart, prices are observed to be trading below the 3.5 - 3.535 support zone. As long as it remains below this level, downward pressure may be felt. In upward movements, the 3.63 and 3.68 levels can be monitored as resistance. The RSI indicator is at 42, indicating a negative outlook. There was a 0.09% decline compared to the previous day. If sustainability above the 3.5 level cannot be achieved, the 3.44 and 3.4 support levels may come into focus.

DAXEUR

Daily Newsletter
22 Nov 2024 10:30

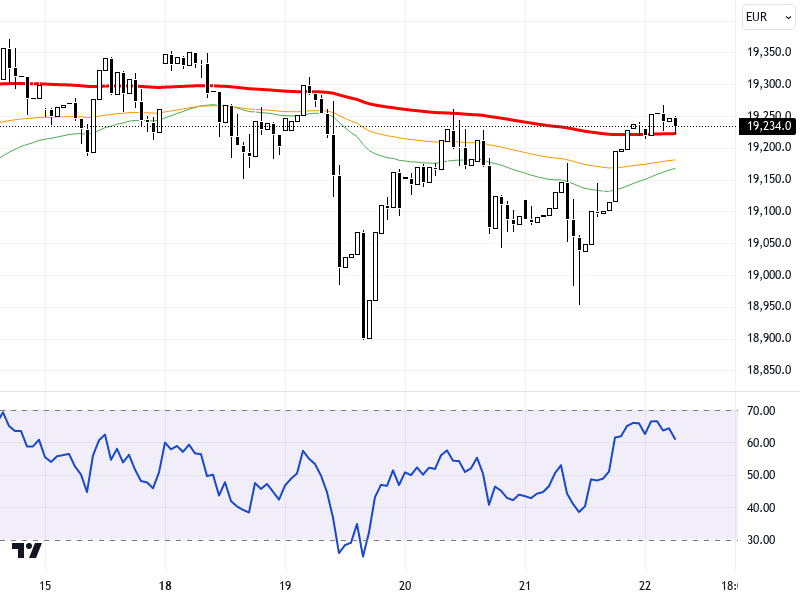
The DAX 40 index is following a negative trend with limited weekly changes under the influence of overall global market uncertainty and economic indicators. Despite the optimism observed in U.S. stock markets, the pressure seen in European markets is affecting the DAX's performance. Particularly, upcoming PMI data from Germany and the Eurozone are among the main figures the market is focusing on. The general negative outlook in Europe, excluding the UK, may exert pressure on the index.

Technically, the DAX 40 index is trying to find support at the levels of 19195, 19090, and 18995. Resistance levels are noted at 19350, 19435, and 19530. The RSI indicator is at the level of 56, showing a neutral market outlook. It is crucial for the index to sustain movements above the 19350 resistance level to continue its upward trend. However, a close below the 19195 level could create pressure towards lower levels. The index has recorded a 0.02% decline compared to the previous day.

BRNUSD

Daily Newsletter
22 Nov 2024 10:30

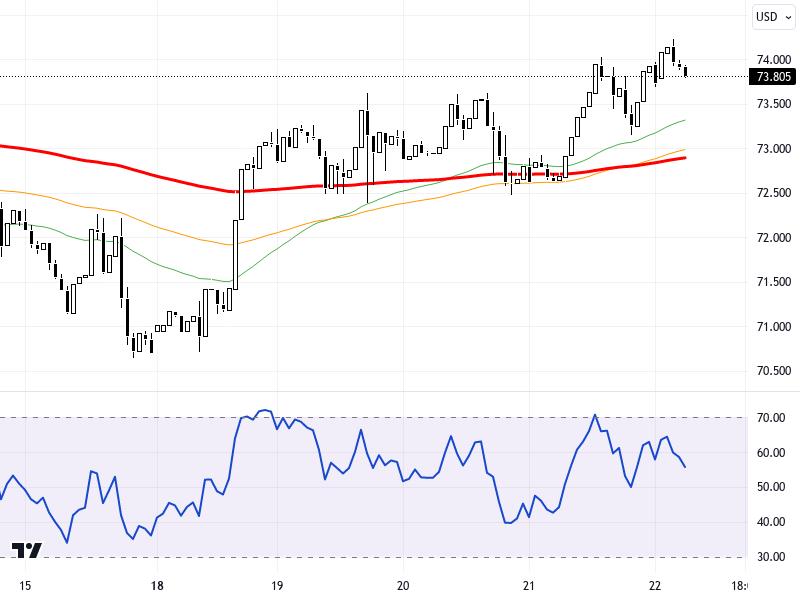
Oil futures continue their rise due to the increasing geopolitical tensions between Ukraine and Russia. Recently, Russia's intercontinental ballistic missile attack on Ukraine heightened risk perception in the markets, influencing oil prices upwards. Additionally, the expectation that OPEC+ may delay the easing of production restrictions at its meeting in early December also supports prices. In light of these developments, movements in the European and US stock markets could also impact oil prices.

Technically, the BRN/USD pair continues to hold above the 73.50 – 74.00 support levels. In upward movements, the resistance levels of 75.00 and 75.50 could be monitored. In case of potential declines, movements below 73.50 could bring the levels of 73.00 and 72.50 into focus. The RSI indicator is close to the 50 level, exhibiting a neutral outlook. The pair has risen by 0.08% on a daily basis, indicating that upward potential still exists.

NDXUSD

Daily Newsletter
22 Nov 2024 10:30

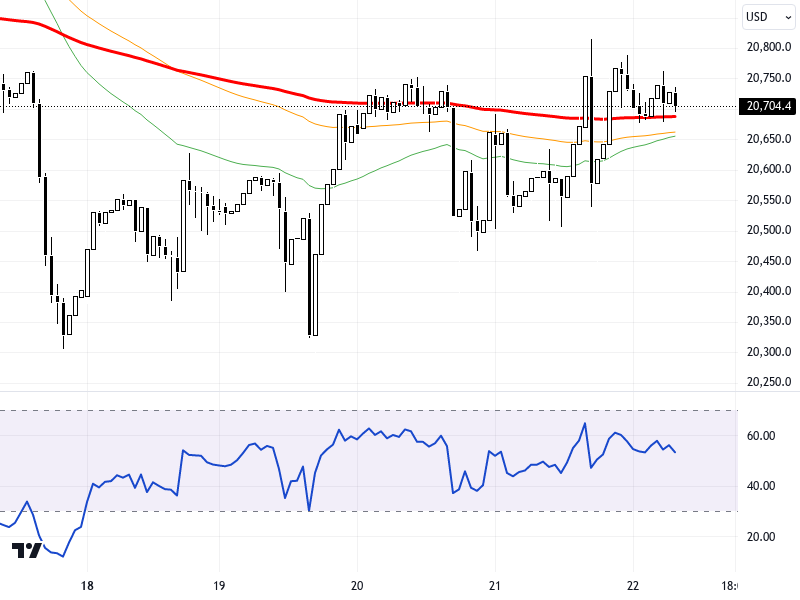
The NASDAQ100 index is experiencing a calm trajectory as movements in the technology sector are limited following Nvidia's financial results, and the 10-year bond yield remains elevated. While interest in cyclical stocks is expected to increase, the index maintains its composure. Leading service and manufacturing PMI data can be monitored throughout the day. The mixed trend in Asian markets and rising geopolitical risks are affecting gold and the dollar. Meanwhile, PMI data in the US and Europe may provide significant insights into economic activity.

Technically, the NASDAQ100 index is trading above the 20680 – 20785 area, supported by the 21-period exponential moving average on the 4-hour time frame. As long as it remains above this area, the index has the possibility of testing resistance levels at 20900 and 21000. However, for a bearish expectation, the index might need to dip below the 20680 – 20785 support zone and close below it on a 4-hour basis. In this scenario, a pullback towards the 20500 and 20375 levels could come into play. The RSI indicator is at level 52, presenting a neutral market outlook. The index has increased by 0.013% compared to the previous day.

XAUUSD

Daily Newsletter
22 Nov 2024 10:30

In a period when geopolitical risks are high, the tension between Ukraine and Russia is supporting gold prices in an upward direction. Especially, Russia’s firing of an intercontinental ballistic missile has increased the demand for safe-haven assets in the markets, contributing to the appreciation of gold. Global economic data and upcoming PMI figures from the US and Europe could also impact developments in the gold market.

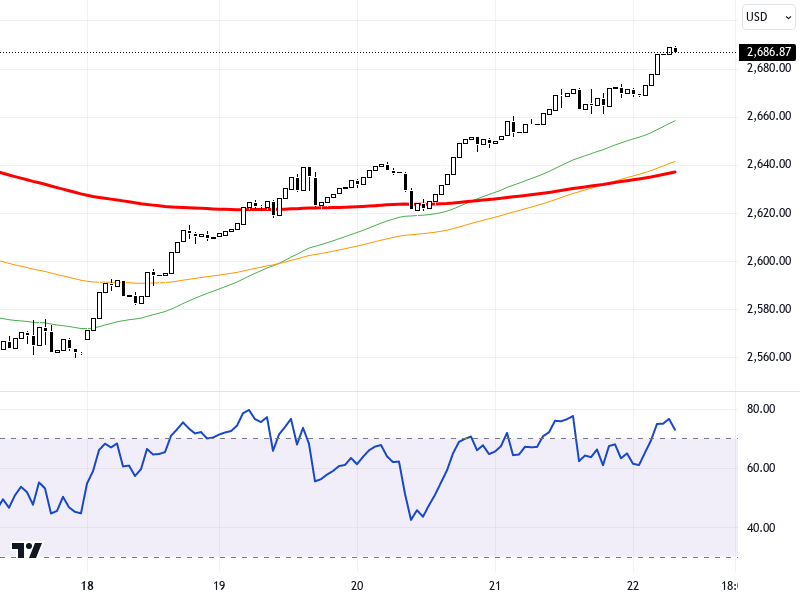
Technically, gold is following an upward trend on the 4-hour chart. The levels of 2680, 2670, and 2660 are identified as significant support areas, with the price trading at 2686.93. The resistance levels of 2693 and 2700 are crucial for upward movements, while the RSI indicator is at 65, displaying a positive outlook. An increase of 0.66% compared to the previous day is observed. Based on this data, the upward trend may continue as long as the price does not fall below the 2660 level.

WTIUSD

Daily Newsletter
22 Nov 2024 10:30

WTI oil prices continue to rise under the influence of geopolitical risks. The increasing tension between Ukraine and Russia has escalated, especially with Russia's intercontinental ballistic missile attack. This situation increases uncertainty in energy markets, exerting upward pressure on oil prices. Additionally, speculations that OPEC+ might delay the decision to ease production cuts in December also support oil prices. Developments in European and US stock markets may influence the direction of oil prices.

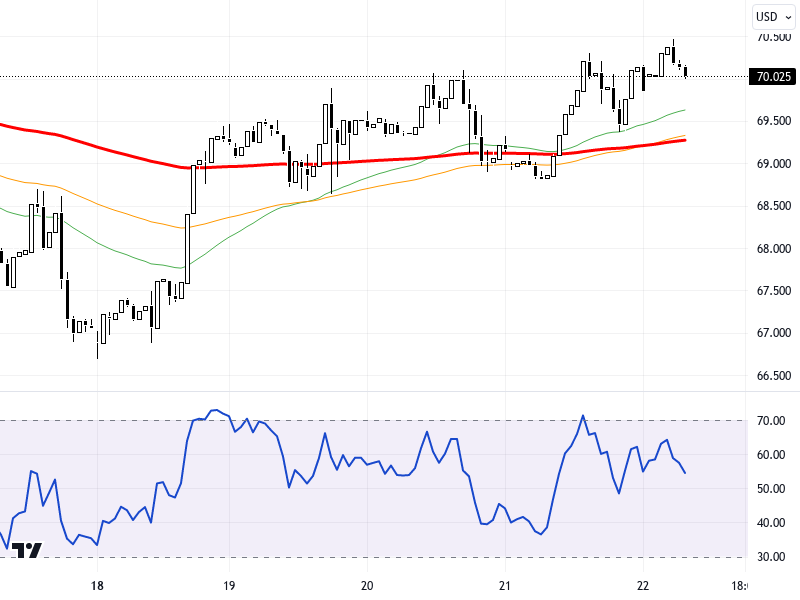
Technically, WTI oil prices are moving just above the 70.00 level on the daily chart. The 70.00 and 69.50 levels are monitored as support, while the 71.00 and 71.50 levels are followed as resistance in upward movements. The RSI indicator is at the 55 level, displaying a positive outlook. The price has increased by 0.24% compared to the previous day. This technical outlook indicates that if prices remain above the support levels, the potential for an upward trend may be maintained.

USDTRY

Daily Newsletter
22 Nov 2024 10:30

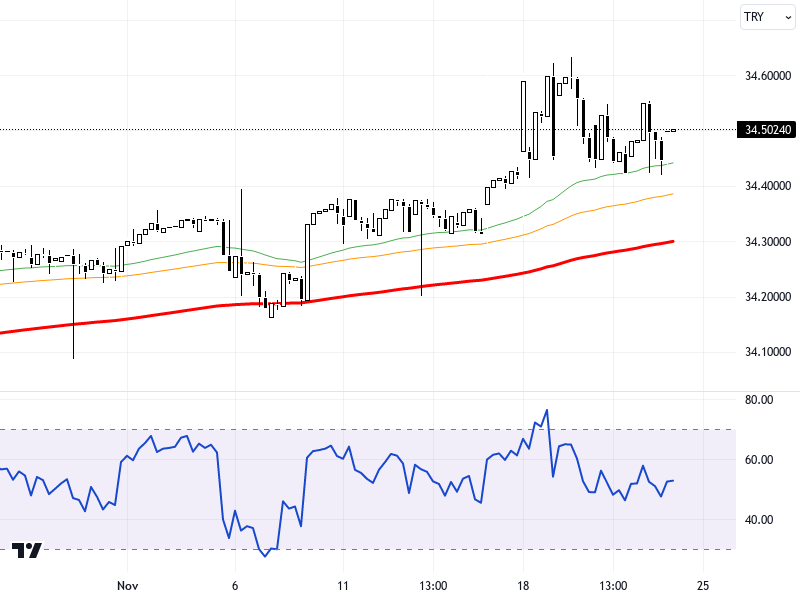
The Turkish Lira continues to show weak performance among emerging market currencies. Particularly diverging negatively alongside currencies like the Philippine Peso and Peruvian Sol, the TL stands out with a 0.11% loss against the USD. In addition to the mixed trend in Asian markets, the increase in geopolitical risks and the expectation that interest rates in the US may remain high for a long time are also boosting demand for the dollar. Under these conditions, the USD/TRY pair is trading at the 34.51 level, and the weak outlook of the TL is leading to upward pressure on the pair.

Technically, the USD/TRY pair may continue its upward movements by staying above the 34.31 support. It is likely to target the 34.57 and 34.66 resistance levels. In particular, maintaining stability above the 34.66 level could further strengthen the current trend. Otherwise, the pair may show a tendency to consolidate between the 34.31 and 34.66 levels. The RSI indicator is displaying a positive outlook at the 59 level. A 0.16% increase in the USD/TRY pair is observed compared to the previous day.

EURUSD

Daily Newsletter
22 Nov 2024 10:30

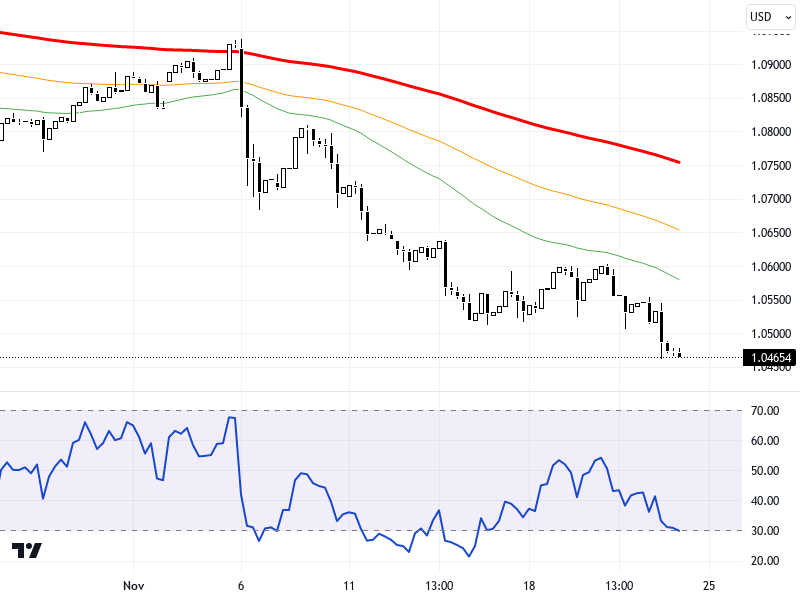
In global markets, the manufacturing and services PMI data from Europe and the US are attracting investors' attention. While the manufacturing sector in the Eurozone continues to signal contraction, the services sector is showing limited growth. On the US side, PMI data indicate a contraction in manufacturing and a growth trend in the services sector. Additionally, the increase in geopolitical risks and the dollar index approaching its highest levels in a year continue to exert pressure on the EURUSD pair.

On the daily chart, the EURUSD pair is moving closer to the 1.045 support level. In downward movements, the levels of 1.0405 and 1.036 can be monitored as support, while upward reactions should watch the resistance levels of 1.049, 1.0525, and 1.056. The RSI indicator is at 48, presenting a neutral appearance. The pair has declined by 0.08% compared to the previous day. A fall below the 1.045 level could increase the negative trend of the price movement.

GBPUSD

Daily Newsletter
22 Nov 2024 10:30

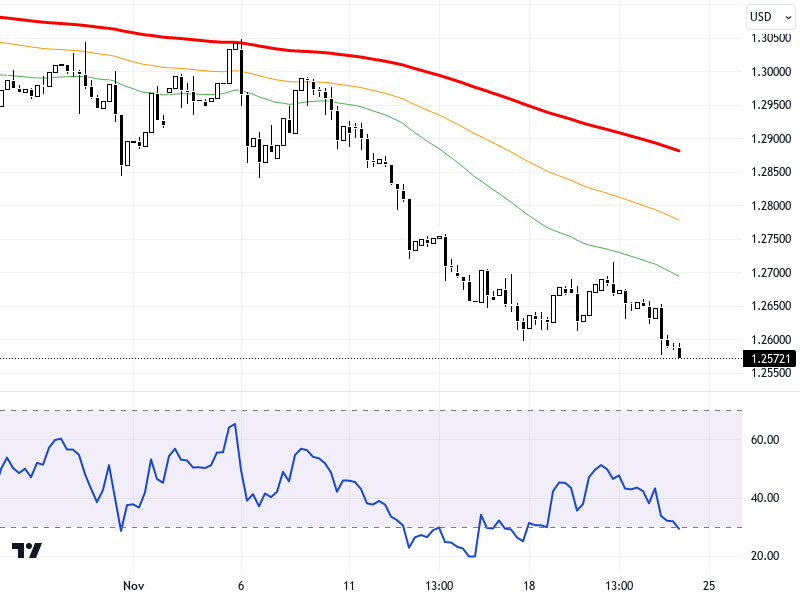
The GBP/USD pair is following a volatile trend in light of global market developments. The Dollar Index reaching its October 2023 peak, PMI data from the US and Europe, and geopolitical risks are influencing the pair. While data on the UK's manufacturing and service sectors provide important clues about economic activity, on the US side, Fed policies and economic indicators are among the factors determining the pair's direction. Particularly, the strong stance of the Dollar Index puts pressure on GBP/USD, and the results of PMI data might increase this pressure.

From a technical standpoint, the GBP/USD pair continues its movement below the 34 and 55-period exponential moving averages in the 1.2660 - 1.2700 range. If the downward movements continue in the pair, which is currently at 1.2572, the support levels of 1.2560, 1.2520, and 1.2485 can be monitored consecutively. In case of an upward recovery, the resistance levels of 1.2600, 1.2660, and 1.2700 will be prominent. The RSI indicator is at the neutral level of 48. The change in the pair shows a 0.14% decrease compared to the previous day.